

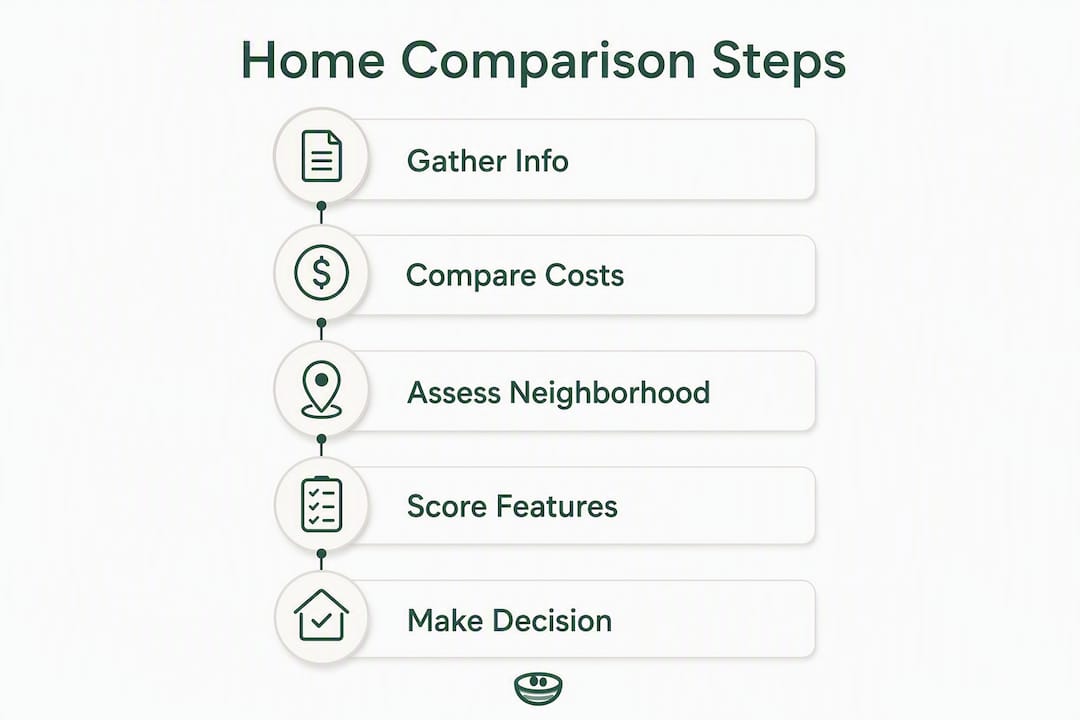
The fastest way to pick the right house is a side-by-side comparison that records the same fields for every listing. Save 2–5 homes, capture core data points for each (such as price, beds/baths, square footage, lot size, property taxes/HOA, condition, and neighborhood metrics), and run a weighted score. That process alone cuts a shortlist of ten down to two in an afternoon.
Quick-start checklist:
- Pick 2–5 listings you've already toured or seriously considered
- Record these core fields for each: price, beds/baths, square footage, lot size, property taxes/HOA, condition and features, and neighborhood metrics (schools, commute, crime)
- Assign a 1–5 importance weight to each category, score each home, and total the results
Immediate next step: open two listings side by side in a tracker or paste them into a spreadsheet template. The sections below give you the exact fields, a printable checklist, and a scoring table you can use right now.
Table of Contents
- What does a side-by-side house comparison actually show you?
- How to set up your comparison: app, desktop, or spreadsheet
- Printable checklist and how to score each home
- How to read your results and avoid common mistakes
- Common approaches to side-by-side comparisons and what to know about privacy
- Key Takeaways
- Why structure beats gut feeling every time
- Nestnoted keeps your comparison private and organized
- Useful sources and further reading
What does a side-by-side house comparison actually show you?
A good comparison view doesn't just line up prices. It exposes the full cost of ownership and the neighborhood context that listing photos deliberately obscure. Here are the six column groups every solid comparison covers, with a note on why each one earns its place.

| Column Group | Key Fields | Why It Matters |
|---|---|---|
| Basic facts | Price, beds, baths, sqft, lot size, year built | Establishes the baseline for apples-to-apples comparison |
| Ongoing costs | Property tax, HOA, insurance, utilities, maintenance | A $300/month HOA adds $36,000 over 10 years |
| Neighborhood factors | School district rating, commute time, crime index, transit access | Often the deciding factor for families and resale value |
| Condition & features | Basement, garage, appliances, HVAC age, recent renovations | Deferred maintenance can erase a price advantage fast |
| Transaction signals | Days on market, price history, recent price drops | A home sitting 60+ days often has negotiation room |
| Sharing & collaboration | Private notes, agent comments, photo links | Keeps candid impressions organized and confidential |
The ongoing-costs column deserves special attention. A $1,000 annual difference in homeowner's insurance adds $10,000 over a decade, and most buyers never model it. Two homes priced identically can diverge by tens of thousands in true ownership cost once taxes, HOA, and insurance are compared side by side.
For buyers looking at duplexes or multi-unit properties, add two more fields: entry configuration (side-by-side vs. stacked) and shared-wall construction quality. These design choices directly affect resale value and rental income potential.
Pro Tip: Always pull the school district rating from a third-party source like GreatSchools.org rather than trusting the listing description. Agents sometimes list the best school in the district, not the one the address is actually zoned for.
How to set up your comparison: app, desktop, or spreadsheet
App path
- Save each listing to your favorites or a named list inside your tracker app.
- Open the saved-list view and select 2–3 homes to compare. Most dedicated trackers surface a side-by-side panel automatically.
- Add private notes immediately after each showing while details are fresh. Use a tool that keeps notes confidential by default so your candid impressions don't surface to sellers.
- Invite your agent or co-buyer to a shared workspace if the tool supports it. Confirm they can see your notes but that the notes stay private from the listing side.
- Enable price-drop alerts so the comparison updates without manual checking.
Desktop path
- Open your tracker or listing platform in a browser. Save each property to a named collection.
- Use the platform's built-in side-by-side view if one exists. If not, open two browser windows side by side and use a browser extension like Tab Resize to split the screen.
- Screenshot the price history graph for each listing and attach it to the property record. Price history tells you whether a seller has already cut once or is holding firm.
- Cross-reference the tax record on your county assessor's website. Listing platforms sometimes display the prior year's tax figure, which can be significantly lower than the current assessed value.
Spreadsheet fallback
A spreadsheet works well for buyers who want full control and don't need real-time syncing. Create these columns: Address, List Price, Beds, Baths, Sqft, Lot Size, Year Built, Monthly HOA, Annual Taxes, Insurance Estimate, Condition Score, Neighborhood Score, Total Monthly Cost, Weighted Score, and Notes.

Add a simple formula for Total Monthly Cost that combines mortgage, HOA, property tax, and insurance estimates; replace rough factors with your actual rate once you have a pre-approval.
Pro Tip: Limit active comparisons to 2–5 homes at once. Beyond five, the cognitive load increases faster than the useful data. If your list grows, archive the weakest candidates and keep the live comparison tight.
The HSBC Home Comparison Checklist uses exactly this column structure across House #1, House #2, and House #3, and it's printable for showings.
Printable checklist and how to score each home
The checklist by category
Basic facts
- Address and MLS number
- List price and price per square foot
- Beds, baths (full and half), square footage, lot size
- Year built and last major renovation
Ongoing costs
- Annual property taxes (verify with county records)
- Monthly HOA fee and what it covers
- Homeowner's insurance estimate
- Average monthly utilities (ask the seller for 12 months of bills)
- Estimated annual maintenance (1–2% of purchase price is a standard rule of thumb)
Neighborhood factors
- School district and assigned school ratings
- Commute time to work (test it at rush hour, not on a Sunday)
- Walkability and transit scores
- Crime statistics from a local police data source
Condition and features
- Roof age and condition
- HVAC system age and last service date
- Basement (finished/unfinished/none), garage (attached/detached/none)
- Kitchen and appliance updates
- Plumbing and electrical system notes
Transaction signals
- Days on market
- Original list price vs. current price
- Number of price reductions
Notes and impressions
- First impression and curb appeal rating (1–5)
- Anything that felt off during the showing
- Agent comments
The HSBC checklist organizes these into Interior and Exterior categories with a printable side-by-side format, which is a solid starting point.
Weighted scoring method
A fit-scoring approach lets you define what matters most and calculate a percent match for each listing. Here's a simplified version:
- List your five priority categories (e.g., price, neighborhood, condition, size, ongoing costs).
- Assign each an importance weight from 1–5 (5 = most important).
- Score each home on each category from 1–5.
- Multiply score × weight for each row.
- Sum the totals. The highest score is your best-ranked home by your own criteria.
| Category | Weight | Home A Score | Home A Total | Home B Score | Home B Total | Home C Score | Home C Total |
|---|---|---|---|---|---|---|---|
| Price | 5 | 4 | — | 3 | — | 5 | — |
| Neighborhood | 4 | 5 | — | 4 | — | 3 | 12 |
| Condition | 3 | 3 | — | 5 | — | 2 | — |
| Size | 2 | 4 | — | 3 | — | 4 | — |
| Ongoing costs | 4 | 3 | 12 | 4 | — | 2 | — |
| Total | 69 | — | — |
Home A edges out Home B by one point here, but notice that Home B scores higher on condition and ongoing costs. That's the value of the table: it shows you where the trade-offs live, not just who wins.
Customize weights for your situation. A family prioritizing schools weights neighborhood at 5. An investor weights ongoing costs and price at 5. Someone with a long commute weights location at 5 and size lower.
How to read your results and avoid common mistakes
Reading weighted scores vs. financial totals
A high weighted score doesn't automatically mean the right buy. If Home A scores 69 but carries a $450/month HOA and aging HVAC, the financial total may flip the decision. Always run the home comparison calculator alongside the weighted score to model cash to close, projected equity, and total cost of ownership over 5–10 years.
Verification checklist
Before acting on your comparison results, confirm these:
- Inspection: Schedule a licensed home inspector before waiving any contingency. Inspections regularly surface $10,000–$30,000 in deferred maintenance that never appears in a listing.
- Permit records: Pull the permit history from your city or county building department. Unpermitted additions can create financing and resale problems.
- Tax records: Verify the current assessed value and tax bill directly with the county assessor, not the listing.
- HOA documents: Request the CC&Rs, reserve fund balance, and meeting minutes. A low reserve fund is a future special assessment waiting to happen.
- Insurance estimate: Get an actual quote before closing. Flood zone designation, roof age, and claims history all affect premiums.
- Days on market and price history: A home that's been reduced twice and sat 90 days is a different negotiation than a fresh listing.
Understanding the interaction between inspections and mortgage underwriting can also affect your offer strategy, particularly if the lender requires repairs before funding.
Common biases to watch for
Anchoring to list price. Buyers who see a $500,000 home first tend to judge all subsequent homes against that number, even when the market doesn't support it. Your weighted score anchors you to your own criteria instead.
Overvaluing staging. A beautifully staged home scores higher on first impression than it deserves on condition. Separate your curb appeal rating from your HVAC and roof scores.
Ignoring ongoing costs. Most buyers compare purchase prices. Few compare the five-year cost of ownership. That's where the real decision lives.
Pro Tip: Ask the seller for 12 months of utility bills and an itemized repair history. This single request reveals deferred maintenance, seasonal cost spikes, and whether the seller has been managing the property or just living in it. It changes decisions more often than any other undocumented check.
Common approaches to side-by-side comparisons and what to know about privacy
Three patterns cover most of what buyers use today.
Built-in listing platform views (the kind you find on major real estate search sites) let you save homes and pull up a basic comparison panel. They're convenient and fast. The limitation is that your saved lists and notes are visible to the platform, and in some cases, your activity signals interest to listing agents. They also tend to show only the fields the platform chooses, not the full checklist you actually need.
Dedicated deal-comparison calculators go deeper on the financial side. A tool like the Florida home comparison calculator models monthly costs, cash to close, total ownership costs, and projected equity across up to three homes, highlighting the best result per category. These are excellent for the financial modeling step but don't handle notes, photos, or collaboration.
Spreadsheet and private trackers give you the most control. You define the fields, you own the data, and nothing is visible to sellers or platforms. The trade-off is manual data entry and no automatic syncing or alerts.
When you save a home to a public platform, your interest is logged. If you're in a negotiation or considering a lowball offer, that visibility can work against you. Private trackers and local spreadsheets keep your notes and shortlist genuinely confidential — which matters more than most buyers realize until they're mid-negotiation.
The right moment to move from a spreadsheet to a dedicated tracker is when you're actively comparing more than three homes, sharing notes with an agent or co-buyer, or need price-drop alerts to keep the comparison current without manual updates. A mortgage pre-approval checklist is also worth running in parallel so your financial inputs (down payment, rate, loan term) are accurate when you model total costs.
Key Takeaways
A structured side-by-side comparison with weighted scoring and verified financial data is the most reliable way to shortlist homes and avoid costly surprises after closing.
| Point | Details |
|---|---|
| Track six column groups | Cover basic facts, ongoing costs, neighborhood, condition, transaction signals, and notes for every listing. |
| Weight your priorities | Assign 1–5 importance scores to categories; multiply by home scores to produce a ranked total that reflects your actual needs. |
| Verify before deciding | Confirm taxes, HOA reserves, permit history, and insurance estimates independently — never rely on listing data alone. |
| Model total ownership cost | Run a financial calculator alongside your weighted score to model total ownership costs. |
| Use Nestnoted for private tracking | Nestnoted syncs listings, stores private notes, and runs side-by-side comparisons without exposing your interest to sellers. |
Why structure beats gut feeling every time
Most buyers think they'll remember what they liked about each house. They won't. After the fourth showing, the homes blur together, and the one with the nicest kitchen tends to win by default, regardless of what the tax bill or roof age actually looked like.
What a structured comparison does isn't just organize data. It forces you to commit to your priorities before you walk through the door, which means you're less likely to get swept up by staging or a seller's narrative. The weighted score is a mirror: it shows you whether the home you're emotionally attached to actually matches what you said you needed.
Nestnoted's private notes and collaborative workspace are built around exactly this discipline. Your impressions stay confidential, your agent can add context without it being visible to the listing side, and the comparison view keeps every field consistent across properties. That combination of structure and privacy is what keeps buyers objective when the stakes are highest.
Nestnoted keeps your comparison private and organized
Most comparison tools show you the data. Nestnoted keeps your reaction to the data private, which is a meaningful difference when you're preparing an offer.

With Nestnoted, you can sync listings directly from major platforms, add confidential notes after each showing, run a side-by-side comparison across saved properties, and get price-drop alerts when a listing changes. Your agent can collaborate in a shared workspace without your candid impressions ever reaching the seller. Everything is free to use with account registration.
If you've been tracking homes in a spreadsheet or relying on a public platform's saved list, try Nestnoted to import your listings and use the built-in comparison checklist. Your notes stay yours.
Useful sources and further reading
A short list of reliable resources for printable checklists, financial calculators, and comparison templates:
- HSBC Home Comparison Checklist (PDF) — A printable side-by-side template with Interior and Exterior fields across three homes. Bring it to showings.
- Home Comparison Calculator — FL HouseHunt — Models monthly costs, cash to close, total ownership costs, and projected equity for up to three homes side by side.
- Home Comparison & Fit Calculator — Martin Goetzinger — A weighted fit-scoring tool that calculates a percent match against your defined priorities.
- Nestnoted — Private listing tracker with built-in side-by-side comparison, notes, alerts, and agent collaboration. Free with registration.